Choose the period.
The highlighted All time button includes all uploaded history. Select a year or month in the real app to focus the entire report on that period.
See what sold. Understand what listeners finished. Know what you earned—and what you were actually paid.
Solti brings your Spotify for Authors exports together in one reporting workspace, so you can spend less time piecing together spreadsheets and more time understanding your catalog.
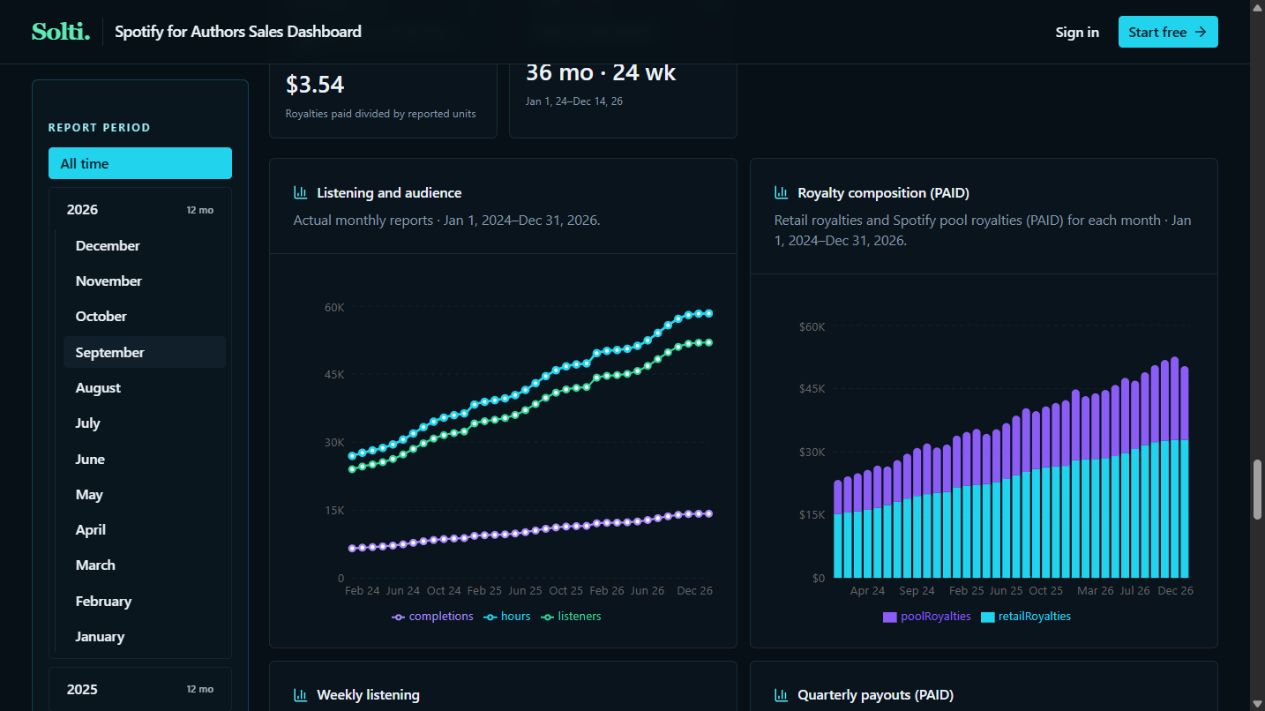
The highlighted All time button includes all uploaded history. Select a year or month in the real app to focus the entire report on that period.
The turquoise line tracks hours, the green line tracks reported listeners, and the purple line tracks completion equivalents. Read across the months to see changes in activity. Completion equivalents measure listening relative to book length—not a count of people who finished.
Each monthly bar stacks retail royalties paid in turquoise and pool royalties paid in purple. The full bar shows the combined amount recorded in that month’s statements.
Monthly insights, digital royalty statements and weekly listening reports each tell part of the story. Bring them together to compare periods, track audience activity and find the books driving your results.
Get sales, listening hours, reported listeners and royalty metrics in one view. Choose an uploaded month, a full year or all available history to put the numbers in context.
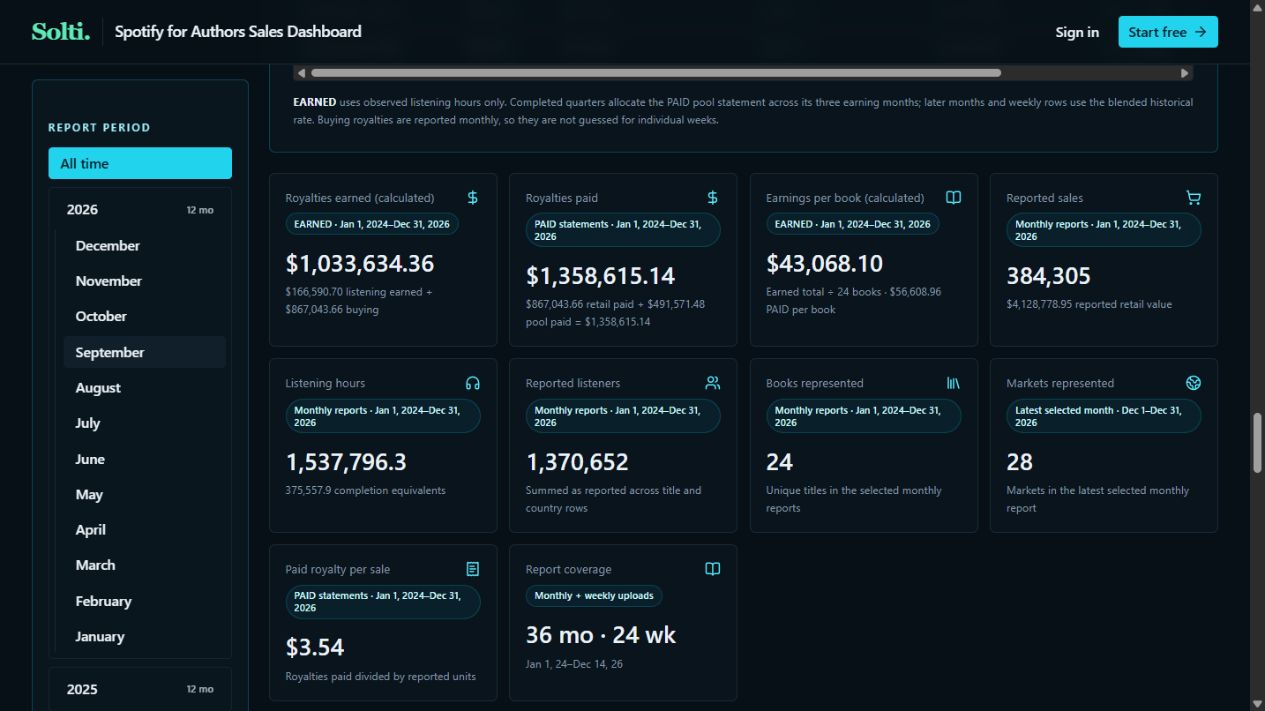
Royalties earned is calculated from observed listening and reported buying royalties. Royalties paid comes from statements. Earnings per book divides calculated earnings across represented titles; reported sales counts units, not dollars.
Listening hours shows consumption; reported listeners shows the totals supplied in reports. Books represented counts titles in the selected reports, while markets represented uses the latest selected monthly report.
Paid royalty per sale divides paid royalties by reported units; it is not a promised rate. Report coverage shows the monthly and weekly files included. The date labels on each card explain its reporting basis.
Calculated earnings use observed listening and historical hourly rates, plus reported buying royalties. They help explain economic performance—not predict future income.
Paid royalties come from Spotify royalty statements. See retail and pool royalties, with monthly views and quarterly totals, without confusing payment timing with listening activity.
Retail value is shown separately from royalty income. Reported listeners are summed as supplied, not treated as deduplicated people.
Your bestseller isn’t always your most-listened-to book. Switch the ranking metric to see your catalog from another angle, then move beyond the top five into the complete book list.
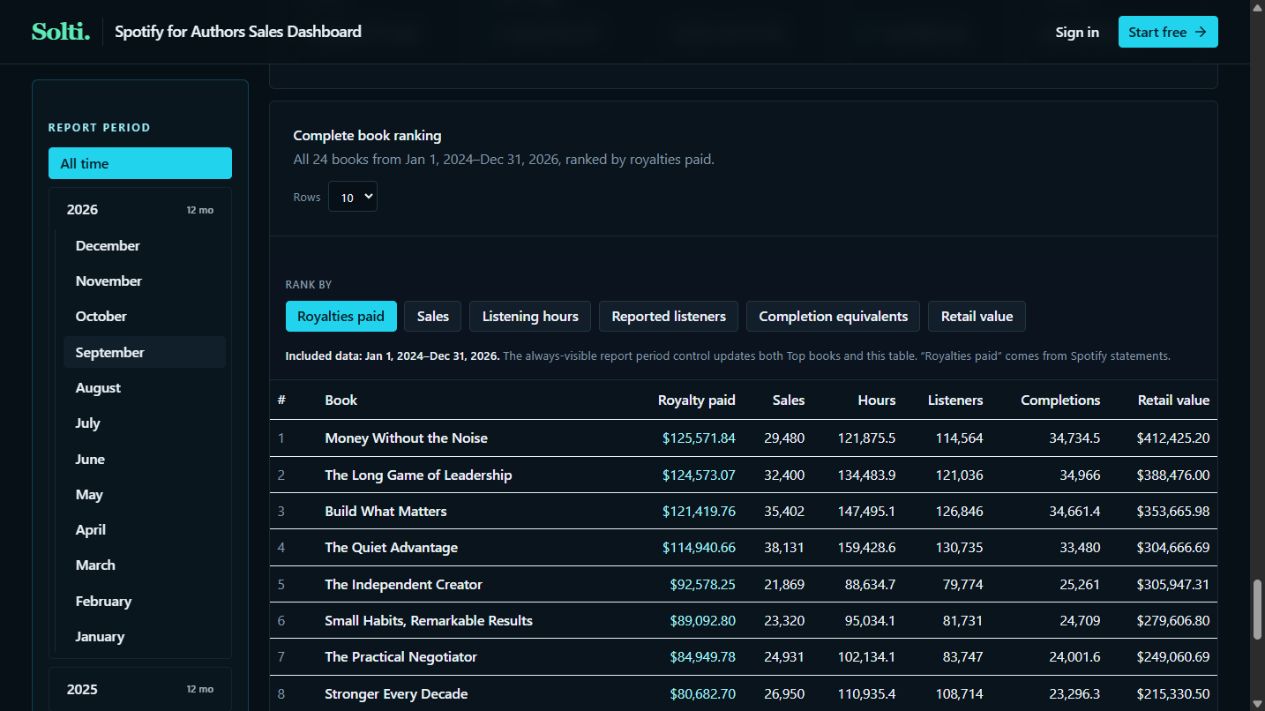
Royalties paid highlights titles receiving the most statement royalties. Switch to Sales for purchased units or Listening hours for consumption. Other buttons rank listeners, completion equivalents or retail value.
Read across a title to compare paid royalties, sales, hours, listeners, completions and retail value. These columns help distinguish a strong seller from a heavily listened-to title. Retail value is not your royalty income.
The Included data line states the date range behind the ranking. The Rows selector changes how many titles appear per page; pagination in the real app lets you continue through the rest of the catalog.
Download monthly insights, digital royalty statements and available weekly listening files from Spotify for Authors.
Upload the reports to your private dashboard. Duplicate reporting periods are identified instead of counted twice.
Review earnings, payments, audience trends and individual book performance. Add new reports as they become available.
The current workflow uses manual uploads of the reports you download from Spotify for Authors. It does not require automatic access to your publishing account.
No. The dashboard focuses on reported periods. Calculated earnings use observed listening and historical rates; paid royalties come from statements.
Yes. The sales reporting homepage has the full interactive product demo with fictional data. Explore its filters, charts and book rankings before creating your own dashboard.
Visit the sales reporting website to explore the demo and create your private dashboard. Your reporting account lives there, separately from this publishing service website.
Explore the real demo, see how the dashboard works, and start with your own reports when you’re ready.
Visit the sales reporting website ↗Reporting tool · Your account and dashboard stay on the reporting site.